Stock Trading for Intermediate: Lesson 1 – Stock Analysis Techniques
08 November 2023
160 views
Introduction to Advanced Stock Analysis
In Stock Trading to Intermediate, you learned the basics of stock analysis using fundamental and technical methods. In this intermediate course, we’ll delve deeper into advanced techniques that can help you make more informed investment decisions. This lesson covers in-depth fundamental analysis, advanced technical analysis, and an introduction to market sentiment analysis.
In-Depth Fundamental Analysis
Assessing Financial Health Beyond Basics
- Free Cash Flow (FCF): Measures the cash a company generates after accounting for capital expenditures.
- Formula: FCF = Operating Cash Flow – Capital Expenditures
- Importance: Indicates a company’s ability to generate cash and fund operations, investments, and dividends.
- Enterprise Value (EV): Represents the total value of a company, including its equity and debt.
- Formula: EV = Market Capitalization + Total Debt – Cash and Cash Equivalents
- Importance: Provides a comprehensive measure of a company’s valuation, useful for comparing companies with different capital structures.
- EBITDA (Earnings Before Interest, Taxes, Depreciation, and Amortization): Measures a company’s overall financial performance.
- Formula: EBITDA = Net Income + Interest + Taxes + Depreciation + Amortization
- Importance: Often used to compare profitability between companies and industries.
- ROIC (Return on Invested Capital): Assesses how efficiently a company uses its capital to generate profits.
- Formula: ROIC = Net Operating Profit After Taxes (NOPAT) / Invested Capital
- Importance: Higher ROIC indicates better performance in generating returns from invested capital.
Advanced Technical Analysis
Key Concepts and Indicators
- Bollinger Bands: Volatility bands placed above and below a moving average.
- Calculation: Bands are typically set two standard deviations above and below the moving average.
- Use: Helps identify overbought or oversold conditions and potential price reversals.
- MACD (Moving Average Convergence Divergence): Trend-following momentum indicator that shows the relationship between two moving averages of a stock’s price.
- Components:
- MACD Line: Difference between the 12-day and 26-day EMA.
- Signal Line: 9-day EMA of the MACD Line.
- Use: Indicates buy and sell signals when the MACD line crosses above or below the signal line.
- Components:
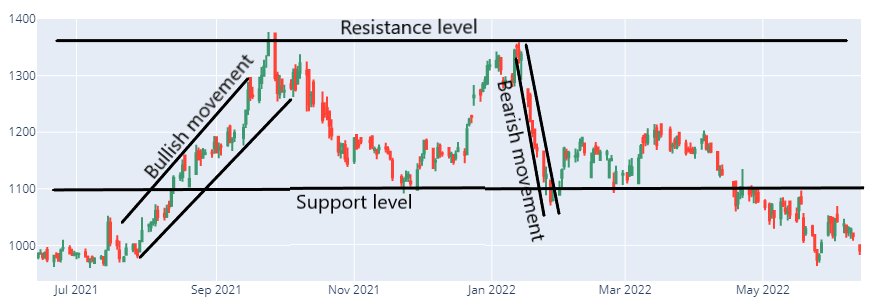
- Fibonacci Retracement: Identifies potential support and resistance levels based on key Fibonacci ratios.
- Levels: Common retracement levels are 23.6%, 38.2%, 50%, 61.8%, and 100%.
- Use: Helps predict potential reversal points during pullbacks in an uptrend or downtrend.

Introduction to Market Sentiment Analysis
Understanding Market Sentiment
Market sentiment refers to the overall attitude of investors toward a particular security or the financial market as a whole. It is often driven by news, economic data, and market events.
- Sentiment Indicators:
- VIX (Volatility Index): Measures market volatility expectations. Higher VIX indicates increased fear and uncertainty.
- Put/Call Ratio: Compares the trading volume of put options to call options. A high ratio indicates bearish sentiment, while a low ratio suggests bullish sentiment.
- News and Social Media Analysis:
- News Impact: Significant news events can sway market sentiment, leading to sharp price movements.
- Social Media Trends: Monitoring platforms like Twitter and Reddit can provide insights into retail investor sentiment and potential market trends.
Practical Application
- Scenario: You are evaluating Company ABC for a potential investment.
- Steps:
- In-Depth Fundamental Analysis:
- Calculate ABC’s FCF to assess cash generation.
- Determine the EV to evaluate overall valuation.
- Analyze EBITDA for profitability comparison.
- Compute ROIC to measure efficiency in generating returns.
- Advanced Technical Analysis:
- Apply Bollinger Bands to identify overbought or oversold conditions.
- Use MACD to spot potential buy or sell signals.
- Implement Fibonacci retracement to identify support and resistance levels.
- Market Sentiment Analysis:
- Check the VIX for market volatility expectations.
- Analyze the put/call ratio for investor sentiment.
- Monitor news and social media for trends and potential impacts on ABC’s stock price.
- In-Depth Fundamental Analysis:
Example
- Company ABC:
- Free Cash Flow: $2 million
- Market Capitalization: $50 million
- Total Debt: $10 million
- Cash and Cash Equivalents: $5 million
- EBITDA: $5 million
- Invested Capital: $30 million
- NOPAT: $4 million
- Financial Metrics:
- EV: $50 million + $10 million – $5 million = $55 million
- ROIC: $4 million / $30 million = 13.33%
- Technical Indicators:
- Bollinger Bands indicate the stock is nearing the lower band, suggesting potential oversold conditions.
- MACD shows the MACD line crossing above the signal line, indicating a buy signal.
- Fibonacci retracement levels show support at 38.2% retracement.
- Market Sentiment:
- VIX is low, indicating low market volatility.
- Put/Call ratio is low, suggesting bullish sentiment.
- Positive news and social media trends indicate strong investor interest in ABC.
Conclusion
Advanced stock analysis techniques provide a deeper understanding of a company’s financial health, market position, and investor sentiment. By incorporating in-depth fundamental analysis, advanced technical analysis, and market sentiment analysis into your investment strategy, you can make more informed and confident investment decisions.


