


Stock Trading for Beginners: Lesson 2 – Analyzing Stocks and Understanding Key Financial Metrics
01 August 2023
257 views
Introduction to Stock Analysis
Stock analysis involves evaluating a company’s financial health, performance, and market position to make informed investment decisions. There are two main types of stock analysis:
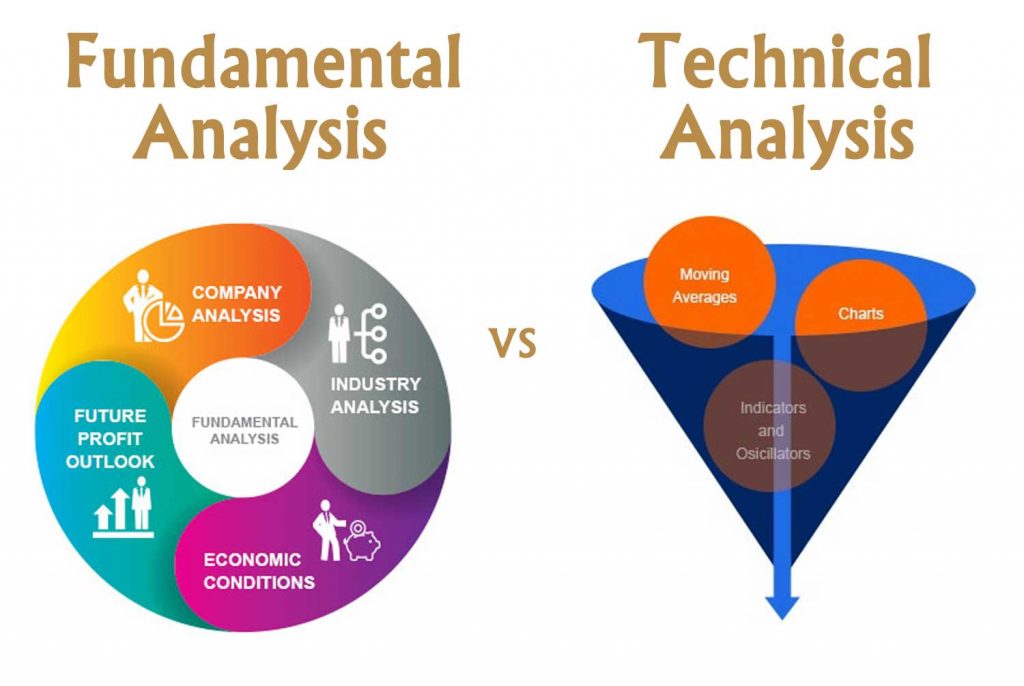
- Fundamental Analysis: Assessing a company’s financial statements, management, competitive advantages, and market conditions.
- Technical Analysis: Evaluating stock price movements and trading volumes using charts and technical indicators.
Fundamental Analysis
Key Financial Statements
- Income Statement: Shows a company’s revenue, expenses, and profits over a specific period.
- Revenue: Total money earned from sales.
- Expenses: Costs incurred in generating revenue.
- Net Income: Profit after all expenses are deducted from revenue.
- Balance Sheet: Provides a snapshot of a company’s financial position at a specific point in time.
- Assets: What the company owns (e.g., cash, inventory, property).
- Liabilities: What the company owes (e.g., debt, accounts payable).
- Equity: The value remaining after liabilities are subtracted from assets.
- Cash Flow Statement: Tracks the flow of cash in and out of the company.
- Operating Activities: Cash generated from core business operations.
- Investing Activities: Cash used for investments in assets.
- Financing Activities: Cash flows from financing activities like issuing stocks or repaying debt.
Key Financial Metrics
- Earnings Per Share (EPS): Measures the company’s profit divided by the number of outstanding shares.
- Higher EPS indicates higher profitability.
- Price-to-Earnings (P/E) Ratio: Compares a company’s current share price to its earnings per share.
- A lower P/E ratio may indicate an undervalued stock, while a higher P/E suggests an overvalued stock.
- Return on Equity (ROE): Measures a company’s profitability by comparing net income to shareholder equity.
- Higher ROE indicates efficient use of equity capital.
- Debt-to-Equity Ratio: Compares a company’s total debt to its shareholder equity.
- A lower ratio indicates less reliance on debt for financing operations.
Technical Analysis
Key Concepts
- Charts: Visual representations of stock price movements over time.
- Line Chart: Plots closing prices over time.
- Bar Chart: Shows opening, closing, high, and low prices for each period.
- Candlestick Chart: Similar to bar charts but with a more visual representation of price movements.
- Trends: General directions in which a stock’s price is moving.
- Uptrend: A series of higher highs and higher lows.
- Downtrend: A series of lower highs and lower lows.
- Sideways Trend: When the stock price moves horizontally within a range.
- Indicators: Tools used to analyze price movements and predict future trends.
- Moving Averages: Average stock prices over a specific period, used to identify trends.
- Relative Strength Index (RSI): Measures the speed and change of price movements, indicating overbought or oversold conditions.
Practical Application
- Scenario: You are considering investing in Company XYZ.
- Steps:
- Fundamental Analysis: Review XYZ’s financial statements to assess profitability, debt levels, and cash flow.
- Check the Income Statement for revenue growth and net income.
- Analyze the Balance Sheet for a healthy asset-to-liability ratio.
- Evaluate the Cash Flow Statement to ensure positive cash flow from operations.
- Calculate Financial Metrics: Determine XYZ’s EPS, P/E ratio, ROE, and Debt-to-Equity ratio.
- Compare these metrics to industry averages to gauge performance.
- Technical Analysis: Use charts to identify trends and key levels.
- Check if XYZ’s stock is in an uptrend, downtrend, or sideways trend.
- Use RSI to determine if the stock is overbought or oversold.
- Fundamental Analysis: Review XYZ’s financial statements to assess profitability, debt levels, and cash flow.
Example
- Company XYZ:
- Revenue: $5 million
- Net Income: $1 million
- Shares Outstanding: 500,000
- Total Debt: $2 million
- Shareholder Equity: $3 million
- Financial Metrics:
- EPS: $1 million / 500,000 = $2 per share
- P/E Ratio: Current Share Price ($20) / EPS ($2) = 10
- ROE: $1 million / $3 million = 33.33%
- Debt-to-Equity Ratio: $2 million / $3 million = 0.67
- Technical Analysis:
- The stock is in an uptrend with higher highs and higher lows.
- RSI indicates the stock is not overbought or oversold, suggesting a balanced market condition.
Conclusion
Analyzing stocks using fundamental and technical analysis is essential for making informed investment decisions. By understanding financial statements, key metrics, and technical indicators, you can evaluate the potential and risks of stocks more effectively.