


Trading Terminology 101
12 декабря 2025
230 views
Trading Terminology 101
Understanding the language of trading is essential for navigating the markets with clarity and precision. Financial markets evolve rapidly, and both professionals and retail traders rely on a shared vocabulary to interpret price action, analyse trends, and respond to events in real time. Mastering this terminology allows traders to read charts more effectively, understand commentary from analysts, and avoid costly mistakes rooted in confusion or misinterpretation. Trading slang also appears frequently in financial media and social networks, making fluency in market language a practical advantage.
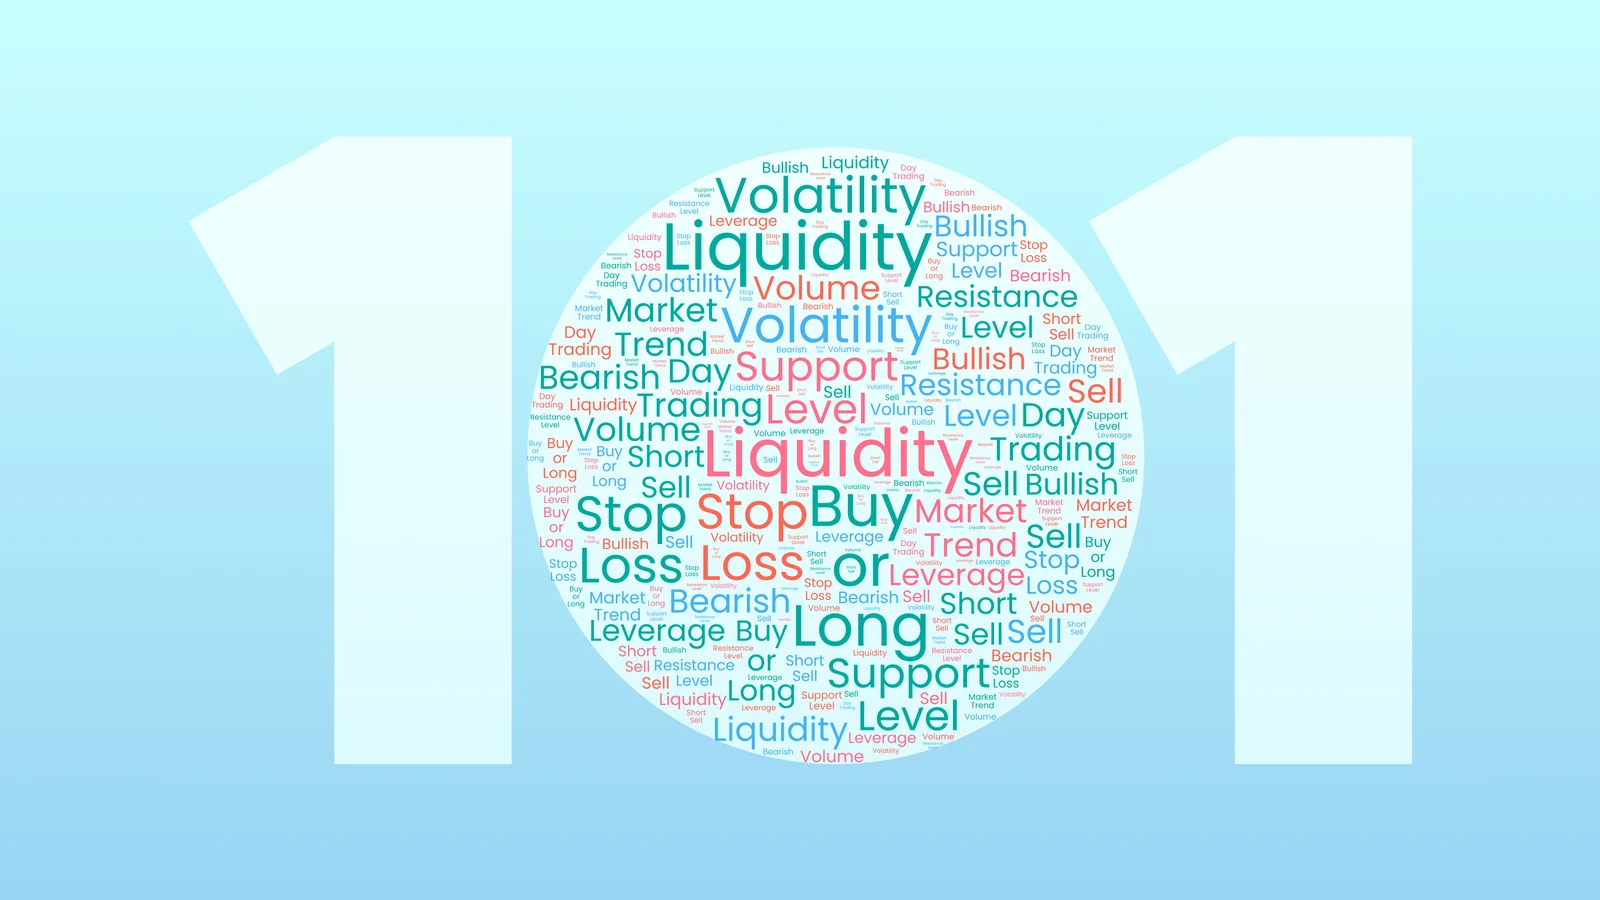
Core Terms Every Trader Should Know
Trading has a distinct vocabulary that reflects the mechanics of buying, selling, and analysing markets. For beginners, understanding these terms helps build a solid foundation for executing trades confidently and interpreting market movements accurately.
Long refers to buying an asset in anticipation of its price rising. A long position does not imply a long holding period; it simply reflects a bullish expectation.
Short refers to selling an asset you do not own, usually through derivatives such as CFDs, with the objective of buying it back at a lower price later. Traders profit if the asset declines in value, making short selling a key strategy in bearish markets.
Leverage allows traders to control a larger position using borrowed capital. While leverage can amplify returns, it also magnifies losses, making disciplined risk control essential.
Lots define the standardised trade size in forex markets. A standard lot in forex equals 100,000 units of the base currency, influencing both exposure and potential profit or loss.
Pips represent the smallest measurement of price movement in currency pairs and form the basis for calculating gains and losses.
Spread describes the difference between the bid and ask prices. It represents a trader’s transaction cost and reflects liquidity conditions. Tight spreads indicate active markets; wider spreads often appear during volatility or low liquidity.
Stop-loss and take-profit orders help automate risk management by closing a position once a price target or risk threshold is reached. They are essential tools for building consistency and protecting capital.
Key Concepts in Technical Analysis
Technical analysis relies on the study of price behaviour and chart patterns to identify high-probability trade setups. This analytical discipline comes with its own set of commonly used terms that traders should recognise.
Candlesticks visualise price movement over a defined period, showing the opening, high, low, and closing prices. The colour and structure of candlesticks provide immediate insight into market sentiment and volatility. Patterns such as Doji, Hammer, or Engulfing formations help traders anticipate potential reversals or continuation signals.
Trendlines connect multiple price points to illustrate the prevailing market direction. They serve as a visual guide to understanding momentum, identifying trend strength, and spotting potential breakouts or breakdowns.
Support and resistance levels represent price zones where assets historically struggle to move below or above. These levels guide entry, exit, and risk-management decisions.
Moving averages smooth price data over specific periods, helping traders identify trends and filter noise. Crossovers between short-term and long-term moving averages are frequently used to signal shifts in trend direction.
Fibonacci retracement levels are used to highlight potential reversal points based on mathematical ratios. They help traders anticipate where price may pause, consolidate, or reverse during ongoing trends.
Market Behaviour and Sentiment Phrases
Market sentiment often drives short-term volatility, making it essential for traders to recognise terms that describe collective behaviour and emotional dynamics.
Bull and bear markets represent broad trends: bullish markets reflect optimism and rising prices, while bearish markets reflect pessimism and declining values.
FOMO (fear of missing out) captures the emotional urge to chase trades after rapid moves, while FUD (fear, uncertainty, doubt) describes negative sentiment that leads to hesitation or panic.
Flight to safety occurs when traders shift capital away from risk-sensitive assets and into safe-haven assets such as gold or government bonds during uncertainty.
Panic selling refers to emotionally driven liquidation of positions, often resulting in rapid price declines and heightened volatility.
HODL, originally a misspelling turned acronym, describes holding an asset despite volatility, most commonly in cryptocurrency markets.
Tanking indicates a sharp, sudden decline in price or poor performance of a market or sector.
A market correction refers to a temporary pullback within a broader trend, usually driven by short-term catalysts.
A dead cat bounce describes a brief, deceptive recovery after a significant decline, often preceding further downside.
A black swan event refers to a rare, unpredictable shock with significant market impact, highlighting the limits of traditional forecasting.
Additional Terms Traders Commonly Encounter
Beyond core trading mechanics and sentiment phrases, financial slang also describes companies and investor types.
Blue chips refer to large, well-established companies with stable earnings and strong reputations. Their stocks are viewed as relatively safe, though they often offer lower volatility and moderate long-term returns.
Unicorns are private start-ups valued at over $1 billion, typically associated with high growth expectations and innovative business models.
Whales refer to market participants with substantial capital whose actions can influence price movements.
Paper hands describe traders who exit positions quickly at the first sign of volatility, reflecting low risk tolerance.
Diamond hands describe traders who hold positions through volatility with strong conviction in long-term outcomes.