


How to Analyze Traders Before You Copy Them
01 декабря 2025
191 views
How to Analyze Traders Before You Copy Them
Most beginners look only at one number when choosing a trader to copy: total return. But this is the least predictive metric of future success. A trader can show impressive gains because of pure luck, excessive leverage, a single explosive month, or unrepeatable market conditions. Copying without deep evaluation is not copy trading — it’s gambling on someone else’s habits, biases, and risk appetite. Sustainable copy trading begins with a full diagnostic analysis of the trader behind the results. This article gives you a professional evaluation framework used by institutional allocators to filter noise, identify real skill, and avoid hidden risks before allocating a single dollar.
Understanding the Trader’s Strategy and Market Logic
A trader’s performance is meaningless unless you understand how that performance is generated. Before copying, analyze what type of strategy they use: trend-following, scalping, swing trading, grid trading, mean reversion, arbitrage, or high-volatility momentum. Each strategy behaves very differently in different market environments and comes with its own risk signature. A trend trader may perform exceptionally during strong directional markets and then stagnate during consolidation periods; a scalper may be consistent during normal volatility but collapse during unpredictable spikes.
The goal is not to find “the best strategy” but to understand how a trader’s approach fits into your portfolio, your risk tolerance, and your expectations. If the trader cannot articulate their strategy or their behavior appears inconsistent, their results will likely be inconsistent as well.
Assessing Performance Quality Beyond Raw Returns
Raw profits do not tell the story. Professionals analyze how profits were made, how stable they were, and how the trader behaved under pressure. A high return achieved with reckless risk-taking is a liability, not an asset. Focus on the key quality indicators: consistency, smoothness of equity curve, stability across different market regimes, and resilience during volatility spikes.
A trader with moderate returns but stable risk metrics is far safer to copy than someone with explosive months followed by deep drawdowns. Sustainable performance is always more valuable than short-term brilliance.
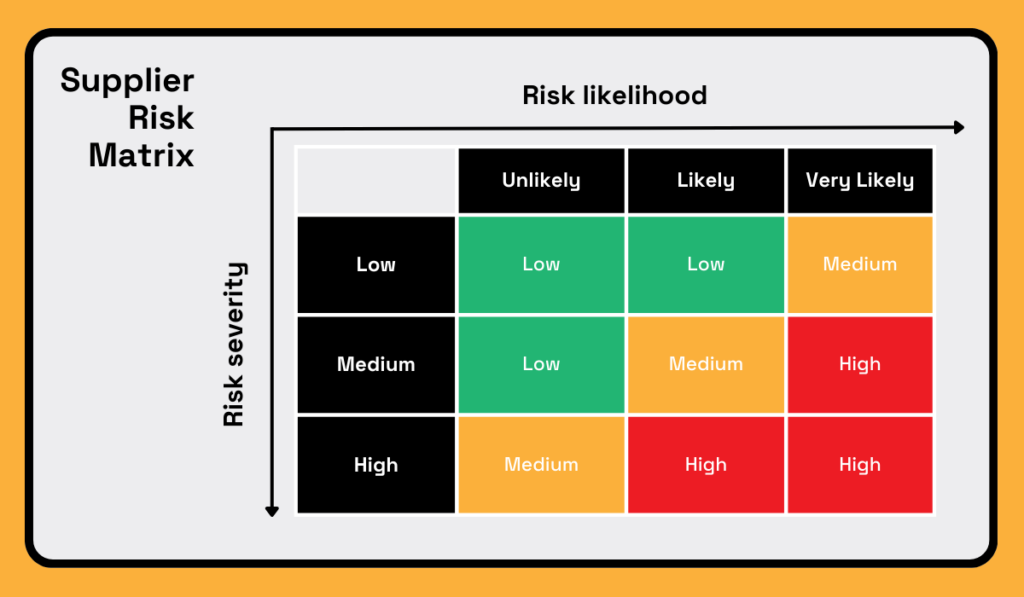
Risk Metrics That Reveal a Trader’s True Nature
Risk defines the difference between sustainable traders and gamblers. Metrics such as maximum drawdown, volatility, Sharpe Ratio, and profit factor reveal how a trader manages uncertainty. Maximum drawdown shows how deep past losses were — and whether your account would have survived them. Volatility indicates emotional and financial stress you must endure while copying. Sharpe Ratio normalizes return by risk, separating disciplined systems from lucky runs. Profit factor evaluates the underlying expectancy of the strategy and its long-term viability.
A trader who scores well across multiple risk metrics is far more likely to deliver consistent, copy-friendly results. Poor risk metrics are a red flag regardless of returns.
Evaluating Behavior During Stress and Market Regimes
Every trader looks brilliant during favorable market conditions. The real evaluation starts during stress. Study how the trader responded during volatility spikes, unexpected events, or losing streaks. Did they stay disciplined or increase position size aggressively? Did they diversify or double down? Did they respect their risk parameters or abandon them under pressure?
Past behavior during stressful periods is the strongest predictor of future resilience. A trader who panics, overtrades, or changes strategies impulsively is dangerous to copy, even if their current performance looks strong.
Risk Management Discipline and Position Sizing
A trader’s risk management is often the deciding factor between longevity and collapse. Look for evidence of structured stop-loss use, consistent position sizing, risk limits per trade, and stable exposure levels. Large and erratic position sizes suggest emotional or impulsive decision-making. Sudden spikes in risk exposure often precede major blowups.
The safest traders are predictable — they size positions consistently, adapt exposure to volatility, and follow predefined risk rules. Their performance curve may look “boring,” but boring is exactly what survives in copy trading.
Trade Frequency, Holding Style, and Execution Quality
Trade frequency tells you how the trader interacts with the market. Very high frequency may indicate overtrading or poor selectivity, while excessively low frequency may reveal inactivity or reliance on a single type of market setup. Examine average holding times: short-term scalpers are highly sensitive to spreads and slippage, which can reduce your copied results; long-term traders may require more patience during slow periods.
Execution quality is equally important. A trader who consistently enters during high volatility or exits late may lack discipline or rely too much on emotion. Smooth execution across large sample sizes indicates professionalism.
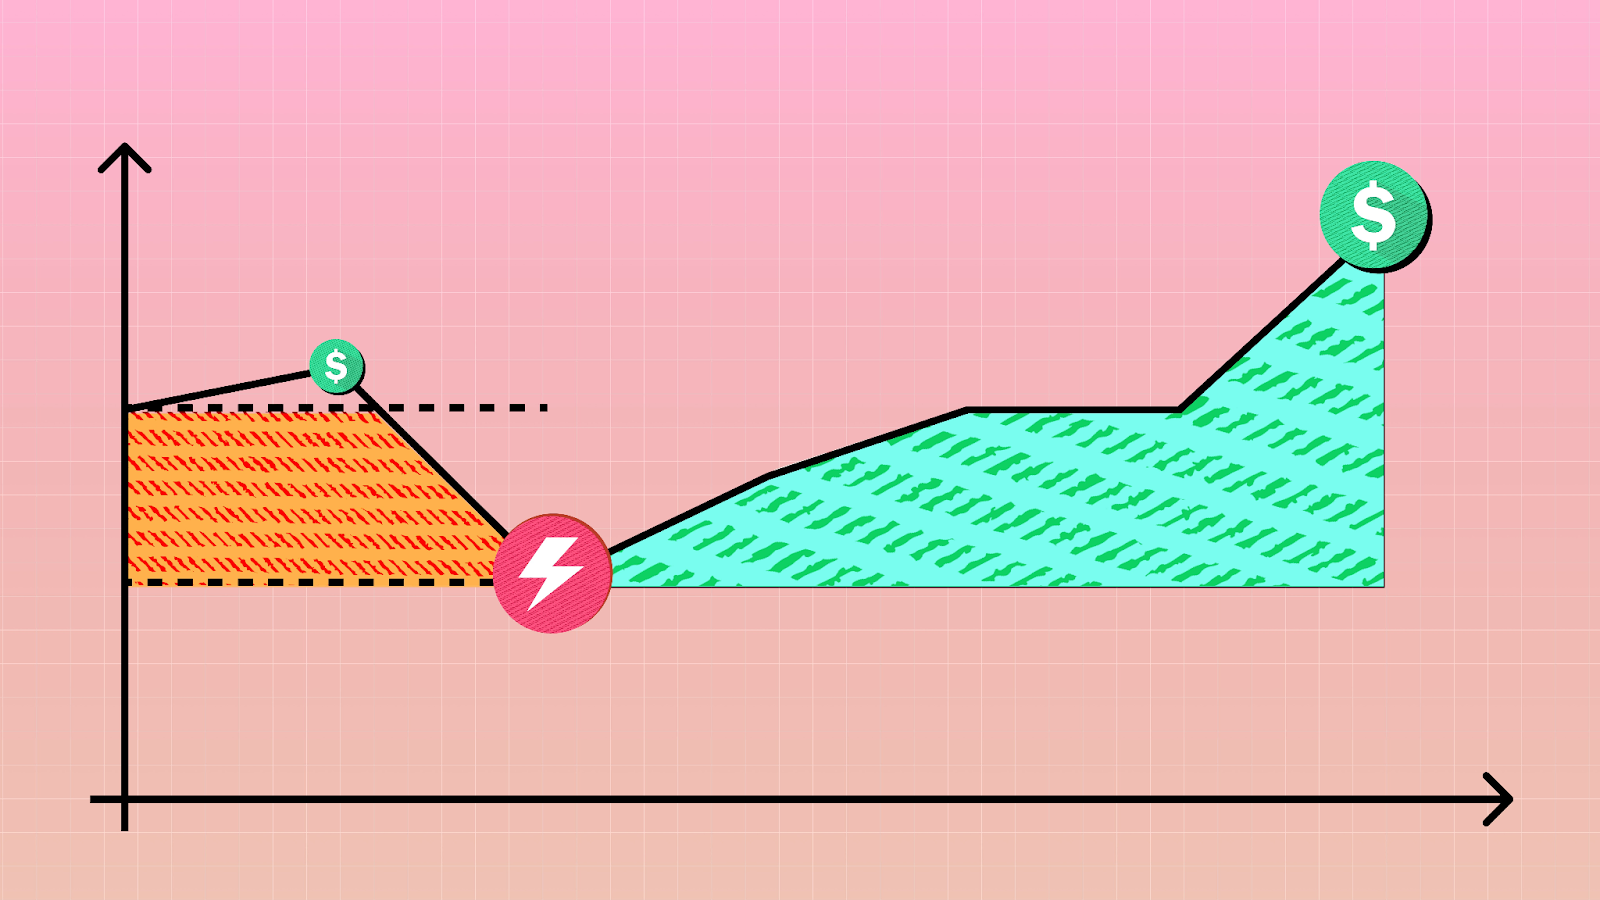
Drawdown Profile and Recovery Behavior
Drawdowns are inevitable, but how the trader recovers from them speaks volumes about their discipline. A healthy recovery curve shows controlled behavior, steady improvement, and a return to normal performance patterns. A dangerous recovery curve shows aggressive risk-taking, revenge trading, doubling positions, or sudden changes in strategy.
A trader who recovers gradually and steadily usually follows a consistent system, while a trader who recovers through one massive lucky trade is relying on gambling behavior. This distinction directly impacts your future returns.
Correlation With Your Existing Portfolio
The right trader for your portfolio is not always the most profitable one. It’s the one whose behavior and risk signature complement your existing positions. If a trader moves in the same direction as others you already copy, your diversification collapses. Analyze correlation across returns, drawdowns, and volatility patterns.
A well-balanced copy trading portfolio consists of multiple strategies that do not react identically to market shifts. Selecting low-correlation traders is a critical part of building a stable long-term allocation.
Detecting Hidden Red Flags and Dangerous Patterns
Even strong performance can hide structural risks. Watch for warning signs: extremely high leverage, oversized positions relative to account balance, martingale or grid trading systems, long periods with no stop-loss use, suspiciously smooth equity curves, or sudden unexplained behavior changes. These patterns often precede catastrophic losses and are rarely visible to beginners.
A safe trader is transparent, consistent, disciplined, and predictable. Anything else should be treated with caution.
Conclusion
Copy trading is not about copying impressive results — it is about copying disciplined, resilient systems operated by professionals who understand risk. The right trader is someone whose behavior, strategy, and risk framework align with your portfolio goals and emotional tolerance.
Deep evaluation transforms copy trading from a high-risk guessing game into a methodical, strategic form of portfolio construction. When you analyze traders with a professional framework, you protect your capital, minimize surprises, and dramatically increase your probability of long-term success.