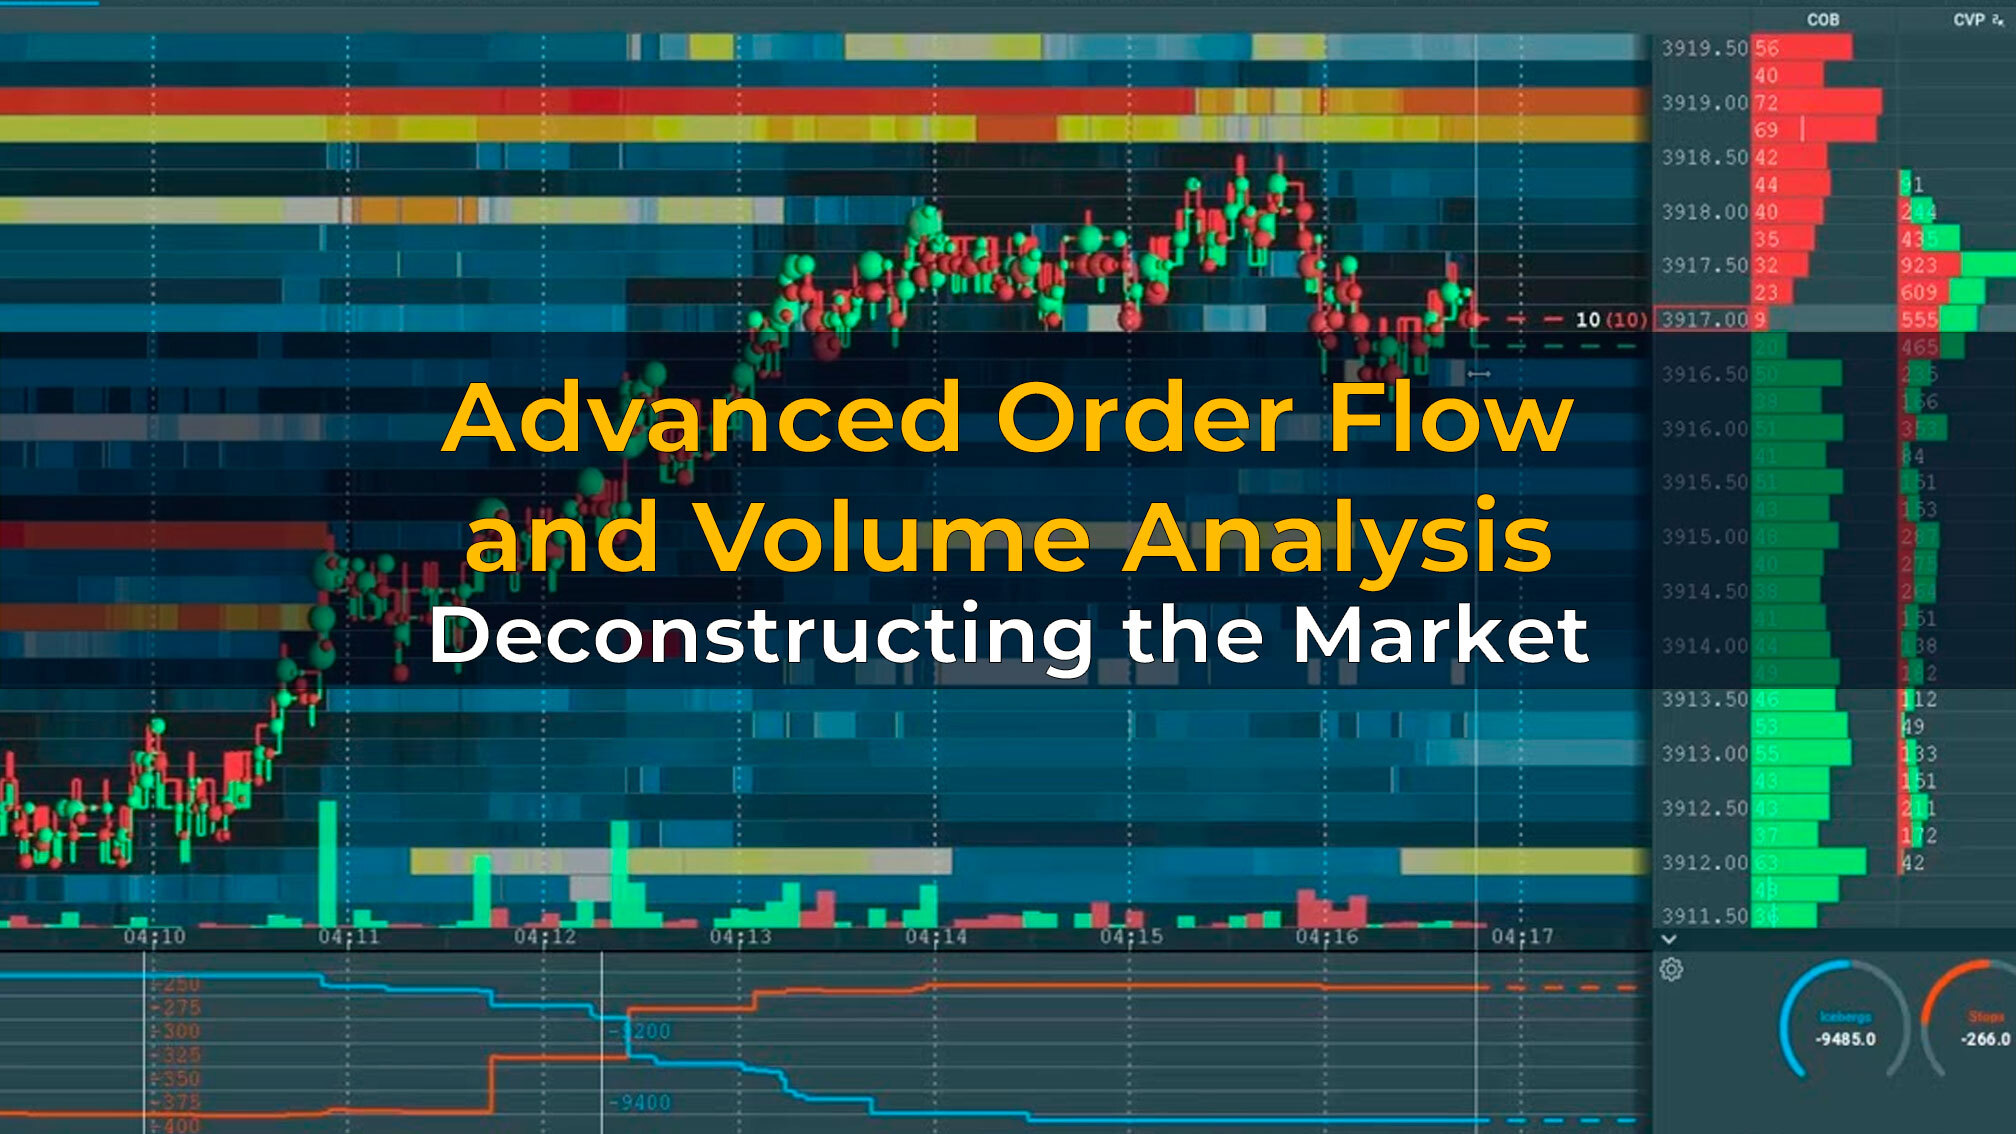


Advanced Order Flow and Volume Analysis
26 октября 2025
254 views
Advanced Order Flow and Volume Analysis
Level: Pro
Core Concept: Beyond basic price action, the true battleground of financial markets lies within the order flow. Advanced traders understand that price moves not just because of broad supply and demand, but due to the aggressive interaction of buyers and sellers at specific price levels. This article delves into professional tools like Footprint Charts, Volume Profile, and Delta analysis, teaching traders to read the real-time motivations of market participants, identify key accumulation/distribution zones, and integrate this insight for precision entries and exits.
Deconstructing the Market: Footprint, Volume Profile, and Delta
These advanced tools provide a three-dimensional view of market activity, revealing details a standard candlestick chart simply cannot.
Footprint Charts (Cluster Charts)
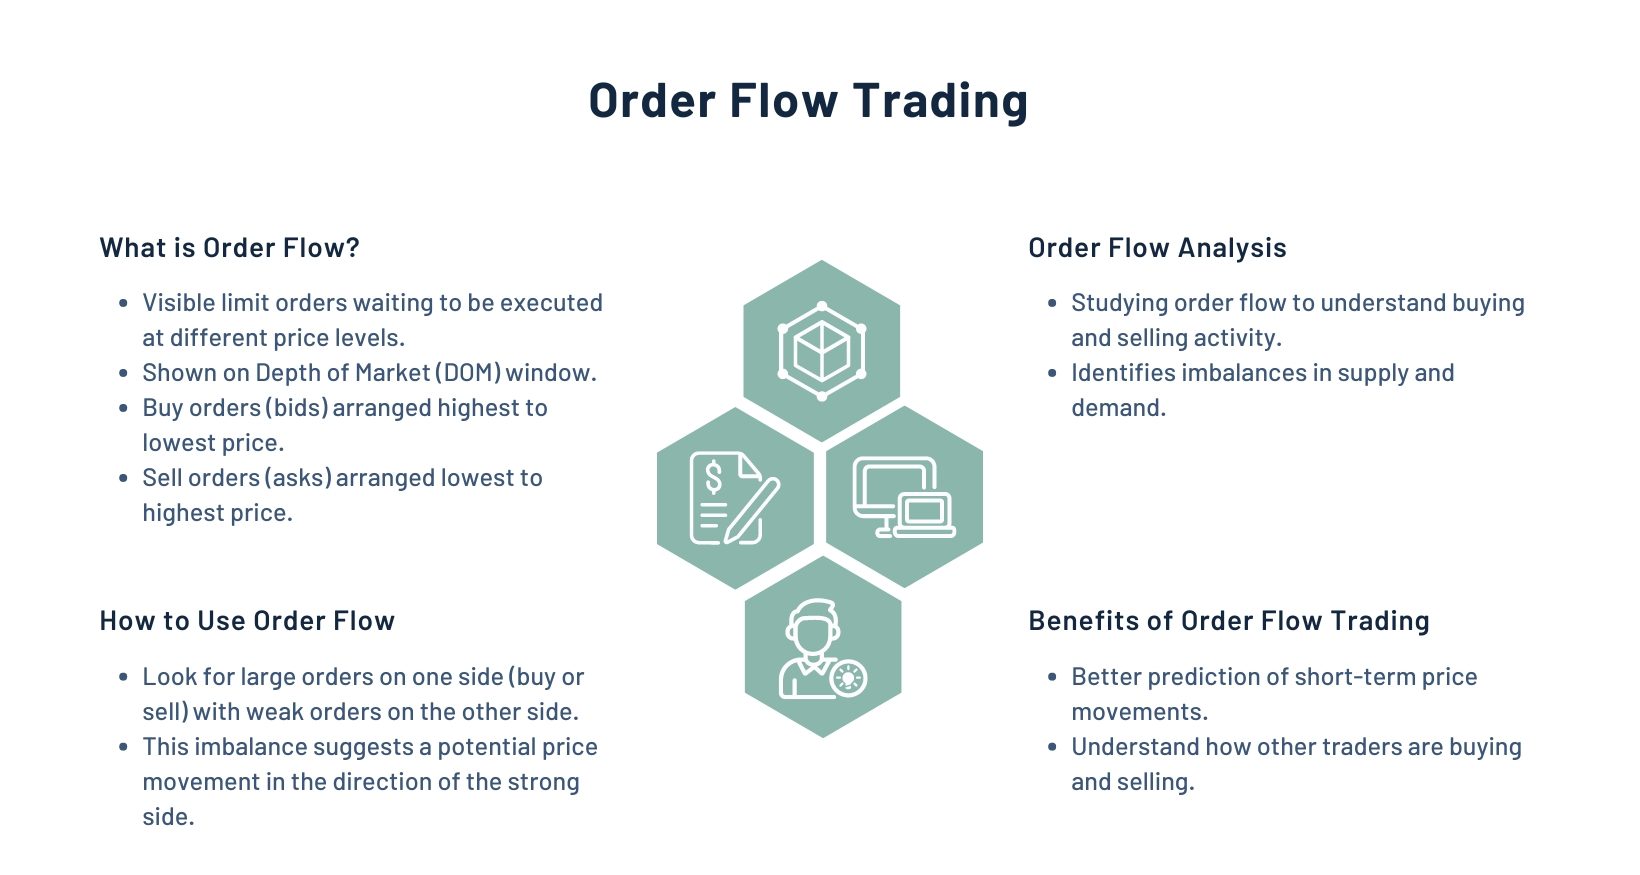
- What it is: A Footprint chart breaks down each candlestick into the actual executed volume at each individual price level within that bar. Crucially, it distinguishes between volume traded at the Bid (seller-initiated) and volume traded at the Ask (buyer-initiated).
- What it shows:
- Volume at Price: Exact amount traded at each tick.
- Aggression: Clear distinction between buyers hitting the Ask and sellers hitting the Bid.
- Imbalances: Reveals where one side (buyers or sellers) was significantly more aggressive than the other at a specific price.
- Why it’s Pro Level: It allows you to see who was in control at each price level within a candle, exposing absorption, exhaustion, and hidden aggression.
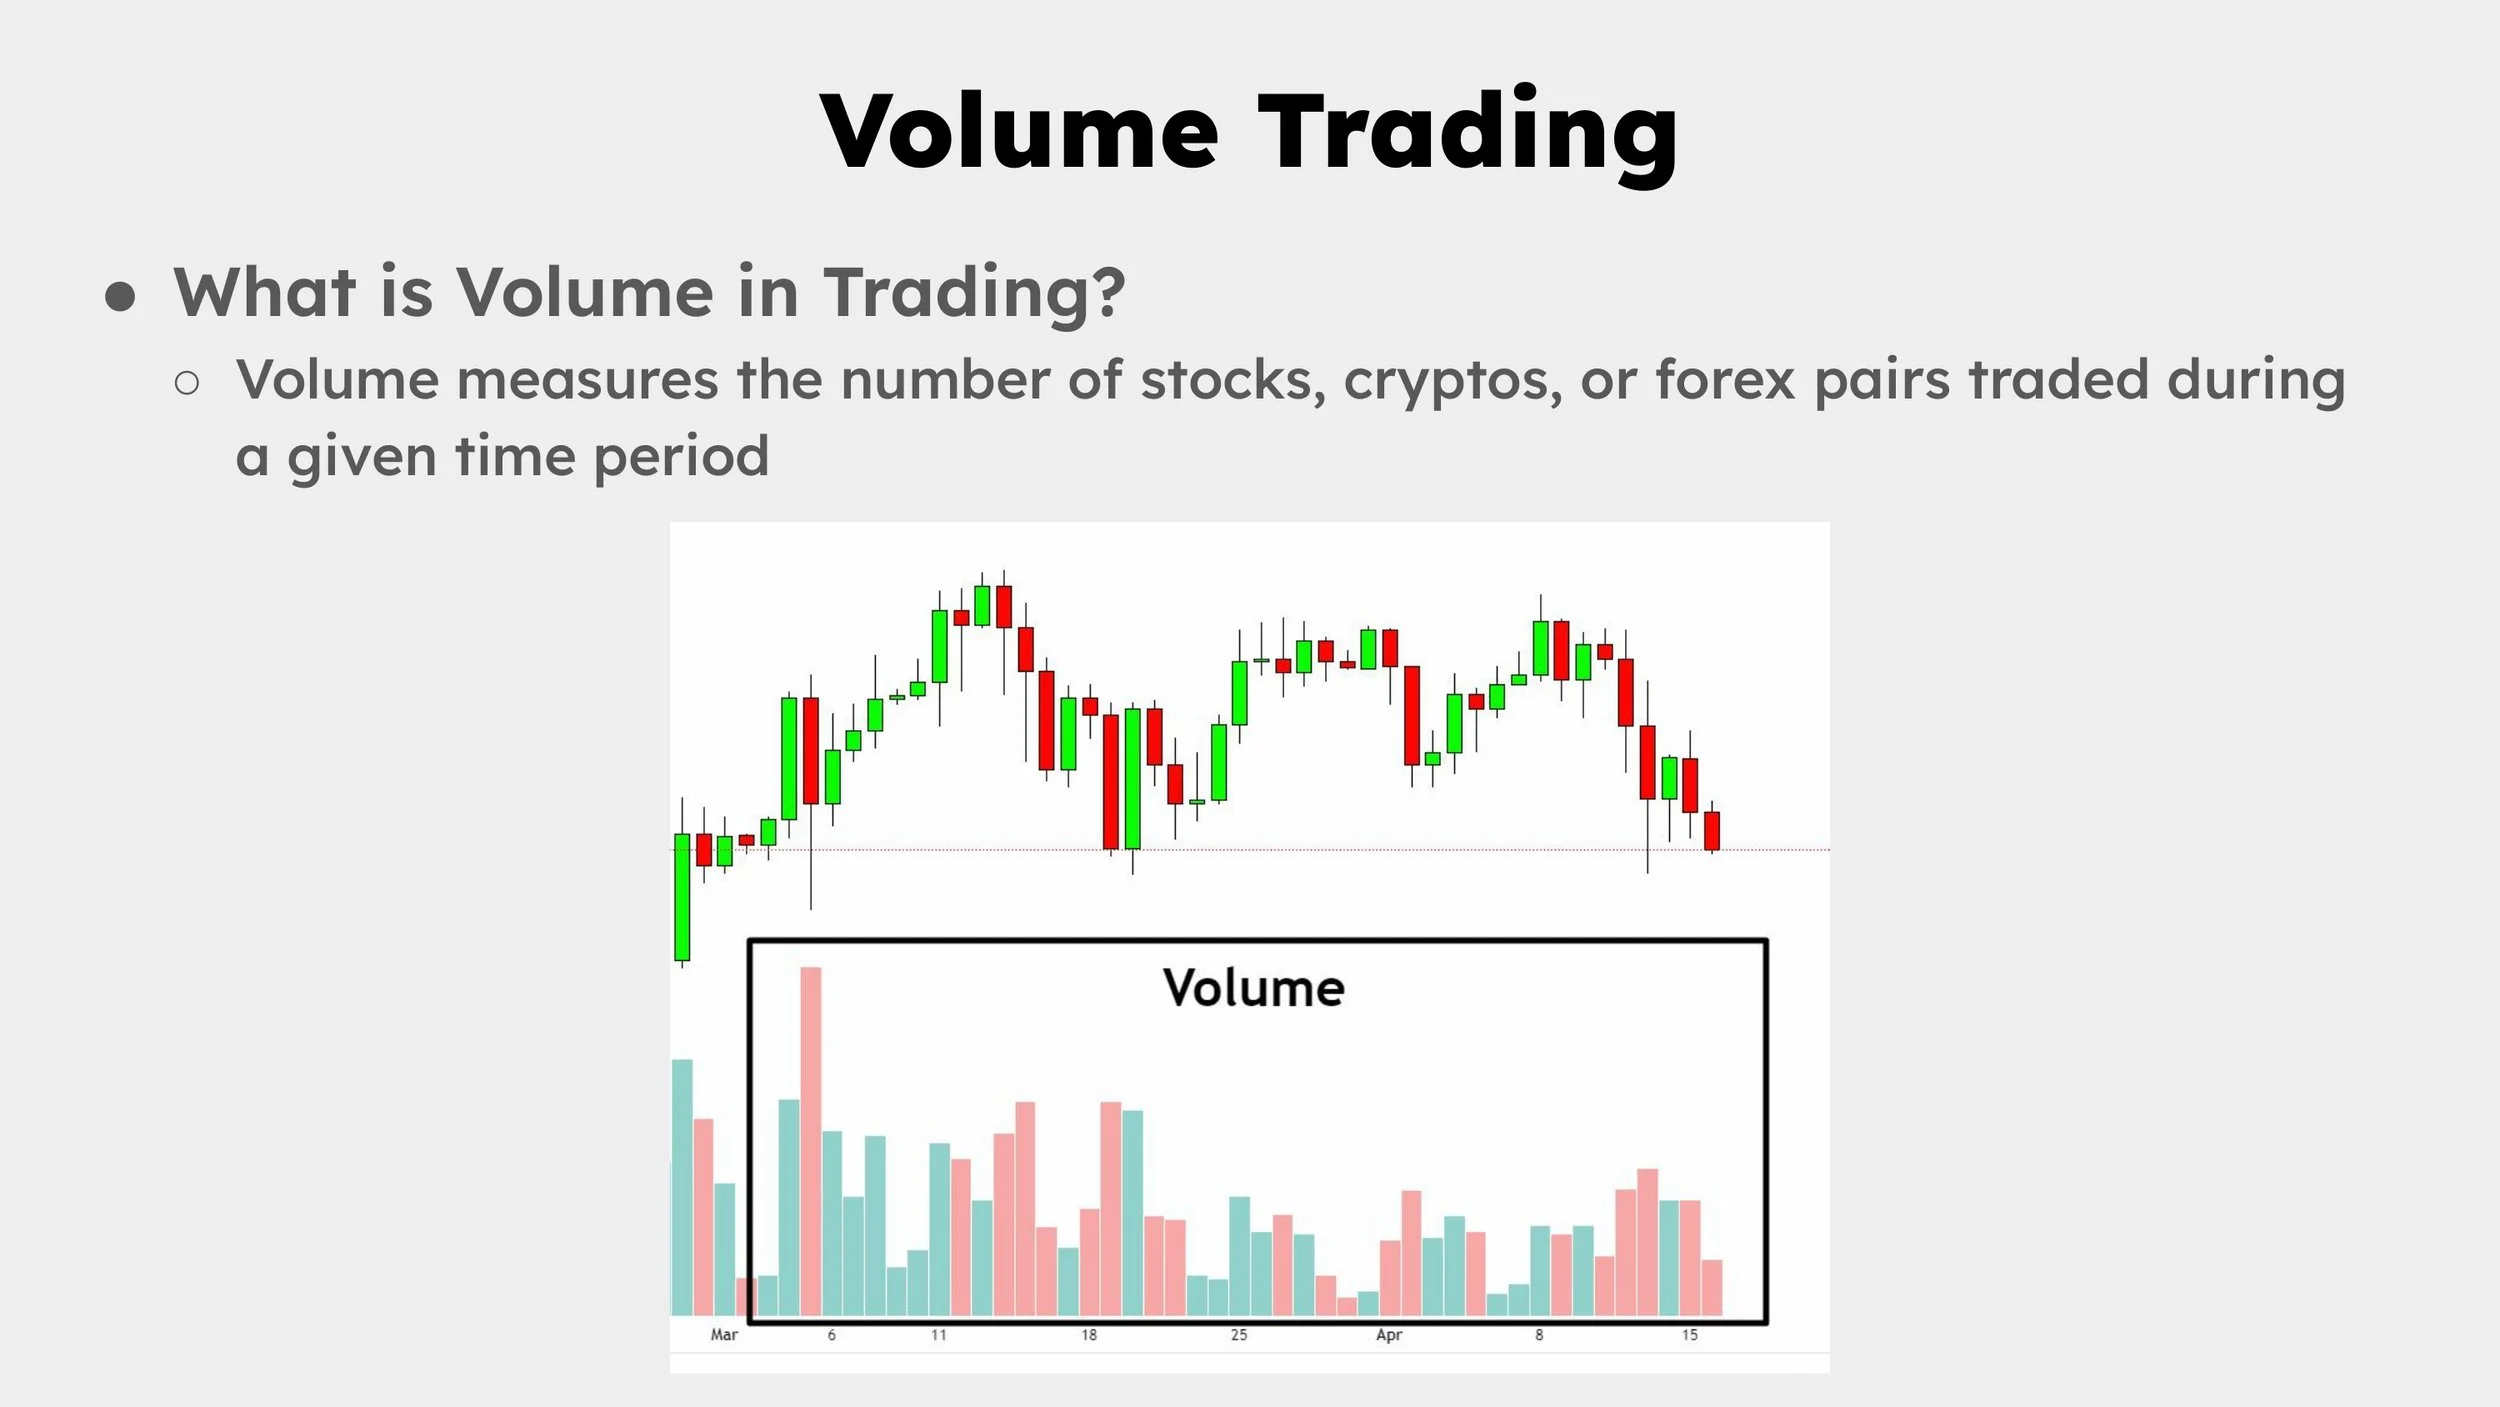
Volume Profile
- What it is: A horizontal histogram that displays the total volume traded at each price level over a specified period (e.g., a trading session, a week, or a specific trend segment). Unlike Footprint, it aggregates volume horizontally.
- What it shows:
- Value Area (VA): The price range where approximately 70% of the total volume was traded. This represents the «fair value» perceived by the market for that period.
- Point of Control (POC): The single price level within the Volume Profile with the highest traded volume. This is the most «accepted» price.
- High/Low Volume Nodes (HVN/LVN): HVNs are price areas with heavy trading (strong support/resistance); LVNs are areas with very little trading (price tends to move quickly through these zones).
- Why it’s Pro Level: Identifies key areas of market acceptance (value) and rejection (non-value), revealing where institutional money is most likely positioned and defended.
Delta (Cumulative Delta)
- What it is: Delta is the difference between the volume traded at the Ask (aggressive buying) and the volume traded at the Bid (aggressive selling) within a specific timeframe (e.g., per candle or cumulative over a session).
- What it shows:
- Positive Delta: More aggressive buying than selling.
- Negative Delta: More aggressive selling than buying.
- Cumulative Delta (CD): A running total of the delta over a session. It shows the net aggression over a longer period.
- Why it’s Pro Level: Delta helps confirm momentum or identify divergence. If the price is rising but the delta is strongly negative (sellers are aggressive), it could signal absorption by limit buyers and a potential reversal.
Reading the Footprint: Aggression, Imbalances, and Absorption
The Footprint chart is a microscope into the supply and demand battle. Mastering its interpretation unlocks powerful real-time insights.
Volume Clusters and Imbalances
- Significant Volume Clusters: Price levels with high volume (many contracts traded) within a single bar indicate strong contention or agreement at that price.
- Aggression and Imbalances:
- Buying Imbalance: When the volume traded at the Ask on one side of a price level is significantly higher (e.g., 300% or more) than the volume traded at the Bid on the opposite side of the next price level. This shows strong aggressive buying.
- Selling Imbalance: The inverse, showing strong aggressive selling.
- Application: Consecutive imbalances in one direction confirm strong momentum. Imbalances that fail to push price further can signal exhaustion or absorption.
Absorption and Exhaustion
- Absorption: Price is moving in one direction (e.g., up) due to aggressive market orders, but the Footprint shows massive volume traded at the Bid (passive limit selling) at the top of the move. This means limit sellers are absorbing all the aggressive buying, often signaling a reversal.
- Exhaustion: Price is moving aggressively, but volume dwindles towards the extremes of the move. This shows the aggressive side is running out of steam, and the move is likely to end.
Key Insight: Footprint charts help identify turning points by exposing hidden supply or demand that a standard candle obscures.
Identifying Accumulation and Distribution Zones with Volume Profile
Volume Profile helps chart the «invisible hand» of institutional positioning, revealing where big players are accumulating (buying) or distributing (selling) assets.
Value Areas (VA) and Points of Control (POC)
- Accumulation (Buying): Long-term buyers often operate quietly, accumulating large positions over extended periods within a Value Area (VA), especially around the Point of Control (POC). The flat «belly» of a Volume Profile often represents this accumulation.
- Distribution (Selling): Similarly, large sellers distribute their positions over time, often within an established VA, particularly when price returns to a previous POC.
- Rotation: When price spends significant time within a VA, moving back and forth around the POC, it signifies a period of «rotation» or «fair value» as both sides balance out.
High Volume Nodes (HVN) and Low Volume Nodes (LVN)
- HVN as Support/Resistance: Areas where significant volume was traded (HVNs) represent strong market agreement on value. Price often finds support or resistance at these levels in the future.
- LVN as Magnets: Areas with very little traded volume (LVNs) indicate strong market disagreement. Price tends to move very quickly through these «voids» until it reaches the next HVN.
Application: Traders can use HVNs and LVNs to predict future support/resistance and anticipate fast moves. Trading «from HVN to HVN» is a common strategy.
Integrating Order Flow into Your Day Trading Strategy
Order flow analysis is not a standalone Holy Grail but a powerful confirmation tool that enhances existing strategies.
Confirmation for Entries
- Breakouts: Instead of blindly entering a breakout, wait for the Footprint chart to show aggressive buying (for a bullish breakout) sustaining above the breakout level, with imbalances confirming new demand.
- Reversals: If price hits a key support/resistance, look for signs of absorption (large limit orders halting aggressive market orders) or exhaustion (aggressive market orders dwindling) on the Footprint chart before confirming a reversal.
Precision Exits
- Exhaustion: If you are long and price is pushing higher, but the Footprint shows aggressive buying drying up or meeting significant limit selling (absorption), it could be an early signal to take partial profits.
- Negative Delta Divergence: If price is making new highs but the Cumulative Delta is diverging (making lower highs or going negative), it signals that aggressive sellers are gaining control despite price action, suggesting a weakening rally.
Contextual Trading with Volume Profile
- Opening Range: The first 30-60 minutes often form the initial Value Area. Trading outside this initial VA (especially through an LVN) can indicate strong directional conviction.
- POC Rejection/Acceptance: If price retests a previous session’s POC and rejects it, it can confirm resistance. If it holds and moves above, it suggests acceptance of a new, higher value.
Conclusion
Order flow and volume analysis provide a level of market insight that standard charts cannot. By mastering Footprint Charts, Volume Profile, and Delta, you gain the ability to read the immediate supply and demand dynamics, understand the true motivation of market participants, and identify precise accumulation/distribution zones. This professional-grade toolkit empowers you to make highly contextual decisions, filter out noise, and significantly refine your entry and exit points for a true edge in the market.