


Forex for Beginners: Lesson 2 – Introduction to Technical Analysis
21 August 2023
237 views
In this lesson, we will explore the basics of technical analysis, a key tool used by traders to make informed decisions. By understanding technical analysis, you’ll be better equipped to analyze currency movements and develop effective trading strategies.
What is Technical Analysis?
Technical analysis is a method used to evaluate and predict the future price movements of currencies by analyzing historical price data and trading volumes. Unlike fundamental analysis, which focuses on economic indicators and news events, technical analysis relies on chart patterns and technical indicators to guide trading decisions.

Types of Charts
Line Charts
Line charts are the simplest type of chart, displaying a line that connects closing prices over a specific period. They provide a clear view of the overall direction of a currency pair but lack detail on price fluctuations within each period.
Bar Charts
Bar charts offer more detail than line charts, showing the open, high, low, and close prices (OHLC) for each time period. Each bar represents a specific time frame, such as one hour or one day, and displays a vertical line with horizontal ticks indicating the opening and closing prices.
Candlestick Charts
Candlestick charts are popular among traders due to their detailed representation of price movements. Each candlestick consists of a body and two wicks (or shadows). The body shows the range between the opening and closing prices, while the wicks indicate the highest and lowest prices during the period. Different candlestick patterns can signal potential market reversals or continuations.
Key Technical Indicators
Moving Averages
Moving averages smooth out price data to identify trends over time. The most common types are:
– Simple Moving Average (SMA): Calculates the average price over a specified number of periods.
– Exponential Moving Average (EMA): Gives more weight to recent prices, making it more responsive to recent price changes.
Moving averages can help traders determine the direction of the trend and identify potential entry and exit points.
Relative Strength Index (RSI)
The Relative Strength Index (RSI) measures the speed and change of price movements. It ranges from 0 to 100 and is used to identify overbought or oversold conditions. An RSI above 70 indicates that a currency pair may be overbought, while an RSI below 30 suggests it may be oversold.
Bollinger Bands
Bollinger Bands consist of three lines: the middle band (a moving average) and two outer bands that are standard deviations away from the middle band. Bollinger Bands help traders assess volatility and potential price reversals. Prices touching or exceeding the outer bands can indicate overbought or oversold conditions.
Understanding Chart Patterns
Support and Resistance
Support and resistance levels are horizontal lines that indicate where the price of a currency pair tends to stop and reverse. Support is a level where the price typically finds buying interest, preventing it from falling further. Resistance is a level where selling interest often prevents the price from rising higher. Identifying these levels can help you determine potential entry and exit points.
Trendlines
Trendlines are diagonal lines drawn on a chart to connect significant highs or lows. They help traders identify the direction of the trend and potential reversal points. An upward trendline connects higher lows, while a downward trendline connects lower highs.
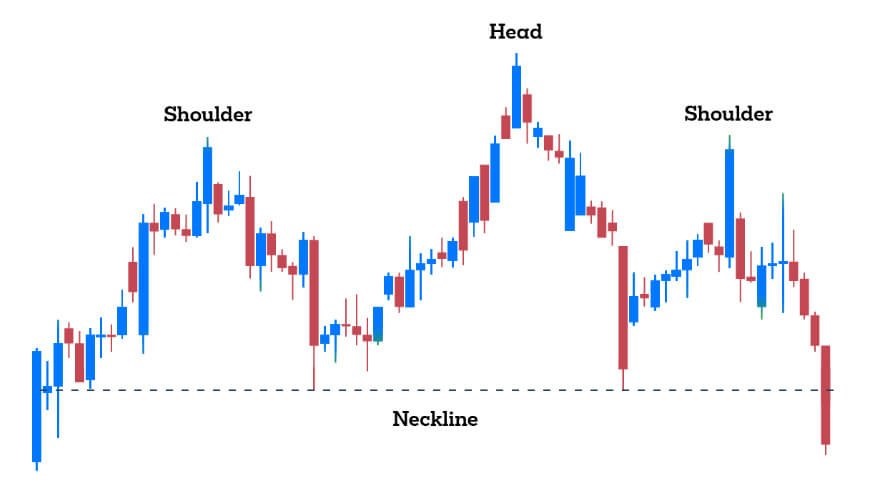
Chart Patterns
Chart patterns are formations created by price movements on a chart and can indicate potential market trends or reversals. Common patterns include:
– Head and Shoulders: A reversal pattern that signals a change in trend direction.
– Double Top/Bottom: Patterns that suggest a potential reversal after a strong trend.
– Triangles: Continuation patterns that indicate consolidation before the trend resumes.
Combining Technical Analysis with Risk Management
While technical analysis provides valuable insights, it’s important to combine it with effective risk management. Always use stop-loss orders to protect your capital and avoid over-leveraging your trades. Diversifying your trades and managing your risk can help you maintain a balanced trading strategy.
Conclusion
In this lesson, we introduced the basics of technical analysis, including chart types, key indicators, and chart patterns. Understanding these tools will help you analyze market conditions and make more informed trading decisions.