


Forex Advanced: Lesson 1 – Technical Analysis
15 February 2024
233 views
Understanding Fibonacci Retracement
Fibonacci retracement is a popular technical analysis tool used to identify potential support and resistance levels based on key Fibonacci ratios (23.6%, 38.2%, 50%, 61.8%, and 78.6%).
– How to Use: Draw the retracement levels from a significant high to a significant low (for a downtrend) or from a significant low to a significant high (for an uptrend).
– Interpretation: Look for price reactions at these levels to identify potential reversal points.
Identifying Harmonic Patterns
Harmonic patterns use Fibonacci sequences to predict future price movements. Common harmonic patterns include the Gartley, Bat, Butterfly, and Crab patterns.
– Gartley Pattern: Characterized by an initial leg (XA), followed by a retracement (AB), then a continuation (BC), and finally another retracement (CD).
– Butterfly Pattern: Similar to the Gartley pattern but with different Fibonacci ratios, specifically the 78.6% retracement of the XA leg.
Using Pivot Points
Pivot points are calculated using the high, low, and close prices of the previous trading day and are used to identify potential support and resistance levels.
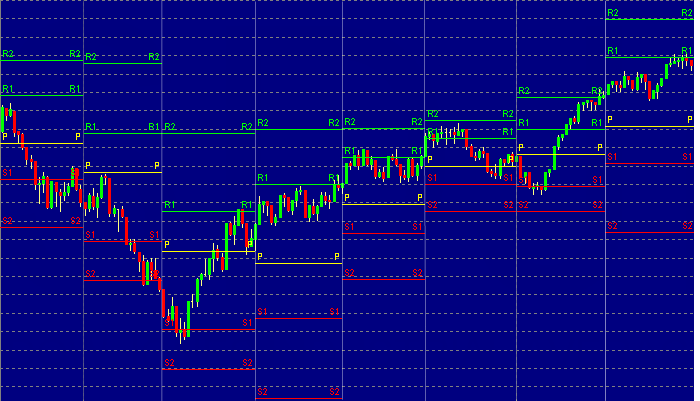
– Calculation:
– Pivot Point (P) = (High + Low + Close) / 3
– Support 1 (S1) = 2P – High
– Resistance 1 (R1) = 2P – Low
– Support 2 (S2) = P – (High – Low)
– Resistance 2 (R2) = P + (High – Low)
Advanced Chart Patterns
Understanding and recognizing advanced chart patterns can significantly enhance your trading strategy.
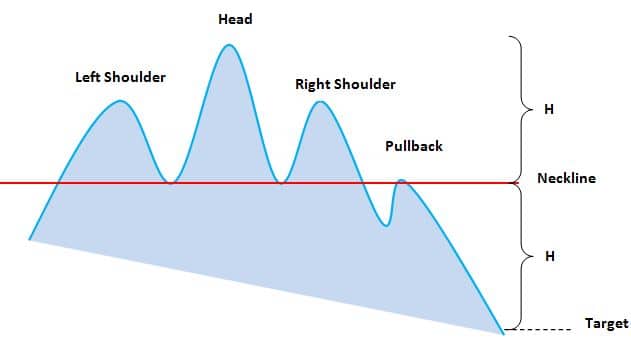
– Head and Shoulders: A reversal pattern indicating a change in trend direction.
– Cup and Handle: A continuation pattern suggesting a bullish trend.
Practical Application
To integrate these advanced technical analysis tools into your trading strategy, follow these steps:
- Identify Patterns and Levels: Use Fibonacci retracement, harmonic patterns, and pivot points to identify key levels.
- Confirm with Indicators: Use indicators like RSI and MACD to confirm potential trades.
- Set Entry and Exit Points: Based on identified patterns and levels, set your entry and exit points.
- Manage Risk: Always use stop-loss orders to manage risk effectively.
Conclusion
Advanced technical analysis tools like Fibonacci retracement, harmonic patterns, and pivot points can provide deeper insights into market trends and potential trading opportunities. Incorporate these tools into your trading strategy to enhance your decision-making process.
In the next lesson, we will explore advanced fundamental analysis techniques and how to incorporate them into your trading strategy.