


Quantitative Trading: From Data to Decisions
27 January 2025
270 views
Quantitative Trading: From Data to Decisions
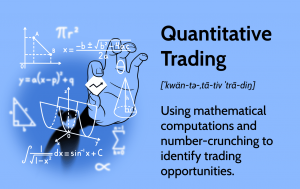
Quantitative trading represents the apex of modern finance, fundamentally reshaping capital markets by replacing human intuition with systematic, data-driven decision-making. At its core, quantitative trading is the discipline of developing and executing trading strategies based on mathematical models and statistical analysis, moving finance into the realm of data science.
Why does this approach dominate? Human emotional trading is inconsistent, while algorithms are capable of analyzing vast datasets, identifying nuanced patterns, and executing trades with disciplined precision, often in milliseconds. This systematic approach reduces cognitive biases and scales strategy execution far beyond the capacity of any manual trader. This article guides advanced traders through the architectural framework of quant systems—how strategies are built, rigorously tested using backtesting, and optimized to survive the demands of live market environments.
Foundations of Quantitative Modeling
Quantitative modeling is the process of translating a market hypothesis into a measurable, executable algorithm. This process is highly dependent on the quality and integrity of the data inputs.
The Key Stages of Data Processing
The construction of any systematic strategy begins with a meticulous workflow designed to transform raw information into predictive inputs:
- Data Collection: This involves sourcing high-frequency market data (price, volume, order book), traditional fundamental data (earnings reports, balance sheets), and increasingly, alternative data (satellite imagery, geolocation data, sentiment metrics).
- Data Cleaning: Raw data is invariably noisy. This stage handles missing values, outlier detection, noise reduction (smoothing), and normalization to ensure data across different time series or assets is comparable. Data integrity is paramount; a flawed input guarantees a flawed output.
- Feature Engineering: This is where raw data is converted into predictive variables, or “features,” that the model can learn from. Examples include calculating volatility metrics from price changes, deriving momentum indicators, or integrating social media sentiment scores.
The rigor applied to these foundational steps directly determines the trading signals’ accuracy and the strategy’s overall longevity.
From Data to Signal: How Strategies Are Built
A trading signal is the output of a quantitative model that dictates the optimal time, direction, and size of a trade. The creation of this signal is the essence of algorithmic trading.
Generating Alpha from Statistical Insights
The goal of signal creation is alpha generation—converting a statistical market insight into an actionable trade that offers a positive expected return, net of transaction costs.
Strategies are often categorized by the statistical edge they exploit:
- Momentum Signals: Built on the premise that assets that have performed well recently will continue to do so in the short term. Features typically involve rolling returns over various lookback periods.
- Mean Reversion: Assumes that prices tend to revert to their historical average (or mean). Signals are generated when an asset deviates statistically significantly from its long-term trend, expecting a correction.
- Factor Models: Exploit established academic factors (e.g., Value, Size, Quality) or newly engineered factors to construct portfolios with systematic exposure to specific market premiums.
- Correlation-Based Signals: Identify breakdowns or unusual tightness in the historical relationship between two or more assets.
Statistical models (like time-series analysis or econometrics) and machine learning algorithms are the engines used to identify the hidden, non-linear relationships that underpin these signals. The model effectively translates complex data relationships into a binary (buy/sell/hold) or continuous (position size) output.
Backtesting and Validation — The Science of Proof
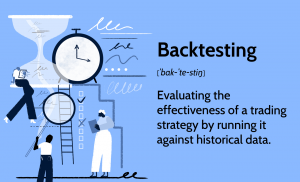
Backtesting is the process of applying a strategy to historical data to determine its hypothetical performance. It is the single most important step in the quantitative workflow, separating genuine market edges from spurious data fits.
Rigorous Testing Methodologies
A professional quant rigorously structures the testing process to ensure robustness:
- Data Split: The dataset is strictly divided into three segments: Training Set (used to fit the model parameters), Validation Set (used to tune hyperparameters and prevent initial overfitting), and the final Testing Set (reserved for a single, final evaluation).
- Walk-Forward Analysis: Considered the gold standard. Instead of a single static test, the strategy is repeatedly re-optimized and tested sequentially on new, unseen segments of data (out-of-sample testing), mimicking how the strategy would be deployed and retuned in a live environment.
Avoiding Validation Pitfalls
Even the best-designed strategy can appear profitable due to testing flaws. Quants must actively guard against:
- Overfitting: Creating a model that performs perfectly on the training data but fails on new data because it has memorized the noise, not the signal.
- Data Snooping Bias: The subtle, unconscious iterative adjustment of a strategy based on previous backtesting results, leading to a strategy that is tuned to history but irrelevant to the future.
- Lookahead Bias: Using future data that would not have been available at the time of the trade decision (e.g., using end-of-day data to generate an intraday signal).
The philosophy is clear: If a hypothesis doesn’t hold up under the harshest scientific testing, it will not survive in the turbulent reality of the market.
Statistical Arbitrage and Machine Learning in Trading
Statistical arbitrage (Stat Arb) is a class of quantitative strategies focused on profiting from short-term mispricings between highly correlated assets. It is a key area where machine learning (ML) provides a distinct competitive edge.
Stat Arb and ML Enhancement
Stat Arb differs from traditional arbitrage because it relies on the statistical expectation of convergence, not a guaranteed, risk-free profit.
- Traditional Stat Arb: Often uses simple models like linear regression or cointegration tests (e.g., pairs trading) to identify when the price ratio between two stocks deviates from its historical mean.
- ML Enhancement: ML models can detect more complex, non-linear relationships and temporary mispricings across a basket of dozens or hundreds of correlated assets. Models like Random Forests or Gradient Boosting can efficiently identify the optimal mean-reverting threshold based on a wide array of economic and technical features, moving beyond simple distance metrics.
Furthermore, Neural Networks and deep learning are used for high-dimensional feature analysis, especially in interpreting order book data and classifying short-term market regimes. Reinforcement Learning provides models with the capacity to adapt their execution strategies and parameter settings as market regimes shift, ensuring the model remains profitable over time.
Key Risk Metrics — Measuring Performance Beyond Profit
For the professional quantitative trader, raw profit is secondary to the quality of that profit. Risk metrics provide the objective framework for evaluating a strategy’s efficiency and resilience.
Core Quantitative Performance Ratios
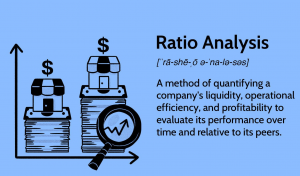
These metrics are essential for professional ESG portfolio management and comparing potential strategies:
- Sharpe Ratio: The most widely used metric. It measures the excess return (return minus the risk-free rate) generated per unit of total risk (volatility). A higher Sharpe ratio signifies a more efficient, risk-adjusted strategy.
Sharpe Ratio=σpRp−Rf
- Sortino Ratio: An improved version of the Sharpe ratio that focuses exclusively on downside risk (negative volatility), ignoring positive price fluctuations. This provides a more accurate picture of capital preservation.
- Information Ratio: Measures the active return (the strategy’s return minus a benchmark’s return) relative to its tracking error (volatility of the active return). The Information ratio is crucial for assessing active managers and algorithmic trading funds against passive benchmarks.
Tail Risk and Drawdown Analysis
Beyond these standard ratios, quants place heavy emphasis on robust drawdown analysis—measuring the maximum peak-to-trough decline in capital. They also analyze tail risk (the probability of extreme, low-frequency events) and volatility clustering (periods of high volatility tend to be followed by more periods of high volatility), which are often addressed through robust stress testing and dynamic capital allocation.
Python and Data Science in Modern Trading Infrastructure
The systematic nature of quantitative trading requires a flexible, powerful, and standardized technology stack, and Python has emerged as the dominant language for the field.
The Python Ecosystem
Python’s suitability is due to its simplicity, large community support, and robust ecosystem of data science libraries:
- Data Manipulation: pandas (for data structures and analysis) and NumPy (for numerical operations) form the bedrock of data handling.
- Machine Learning: scikit-learn offers comprehensive classical ML tools, while TensorFlow and PyTorch are essential for deep learning applications.
- Backtesting and Execution: Libraries like Zipline and backtrader facilitate efficient strategy development and simulation.
The typical workflow begins with data import into a pandas DataFrame, followed by feature engineering, signal generation using scikit-learn, final backtesting, parameter optimization, and eventual deployment through API-driven execution systems connected to broker platforms.
Building Robust Quant Systems — The Human-Machine Synergy
The popular image of quantitative trading systems running untouched is misleading. Successful execution requires continuous monitoring and human oversight, representing a crucial human-machine synergy.
Continuous Adaptation and Oversight
Model performance naturally degrades over time as market dynamics change—a phenomenon known as parameter drift or concept drift.
- Model Monitoring: Systems must continuously monitor key performance indicators (KPIs) and alert analysts to sudden changes in expected returns, risk metrics, or transaction costs.
- Parameter Drift Detection: Quants use statistical tests to check if the underlying relationship between the input features and the target variable has changed significantly, triggering a mandatory re-calibration or optimization.
- Market Regime Adaptation: Advanced systems, often using adaptive algorithms, can detect significant shifts in volatility shifts or liquidity shocks and automatically temper their aggression or switch to a different, pre-validated sub-strategy.
Human oversight remains critical for addressing ethical concerns, ensuring regulatory compliance, and applying contextual judgment to “unknown unknowns”—events the model has no historical data to train on.
Challenges and Limitations of Quantitative Trading
Despite its rigor, the quantitative approach is not without significant risks and inherent limitations.
Hidden Risks and Data Dependencies
The very reliance on data creates new vulnerabilities:
- Overfitting: The primary risk, as discussed, where a strategy is an illusion of profitability based on historical data quirks.
- Execution Costs: Trading frequently incurs significant transaction costs, and models often fail if execution quality (slippage) is not accurately modeled during backtesting.
- Changing Correlations: Stat Arb strategies can fail spectacularly when seemingly stable market correlations break down permanently due to structural shifts.
- Black Box Opacity: Complex deep learning models are often “black boxes,” making it difficult to interpret why a specific trade was generated. This lack of interpretability poses a major challenge for risk management and debugging.
Ultimately, data science and algorithms cannot predict “Black Swan events”—low-probability, high-impact events that have no precedent in the training data. The risk of these events must be managed through position sizing and systemic diversification, not model prediction.
Conclusion — Turning Data into Discipline
Quantitative trading is the embodiment of disciplined, probabilistic investing. It is not about predicting the future; it is about managing risk, identifying statistical anomalies, and rigorously adhering to a systematic process. By leveraging data science, rigorous backtesting, and key risk metrics like the Sharpe ratio, advanced traders transform emotional impulses into actionable algorithmic trading systems. The modern quant views data not as a source of complexity, but as the only reliable tool for achieving clarity, consistency, and controlled risk exposure in today’s volatile financial markets.